Project overview · Original research
What Counts as a Change Order?
A self-directed white paper built entirely from public federal data, along with the full content program planned around it.
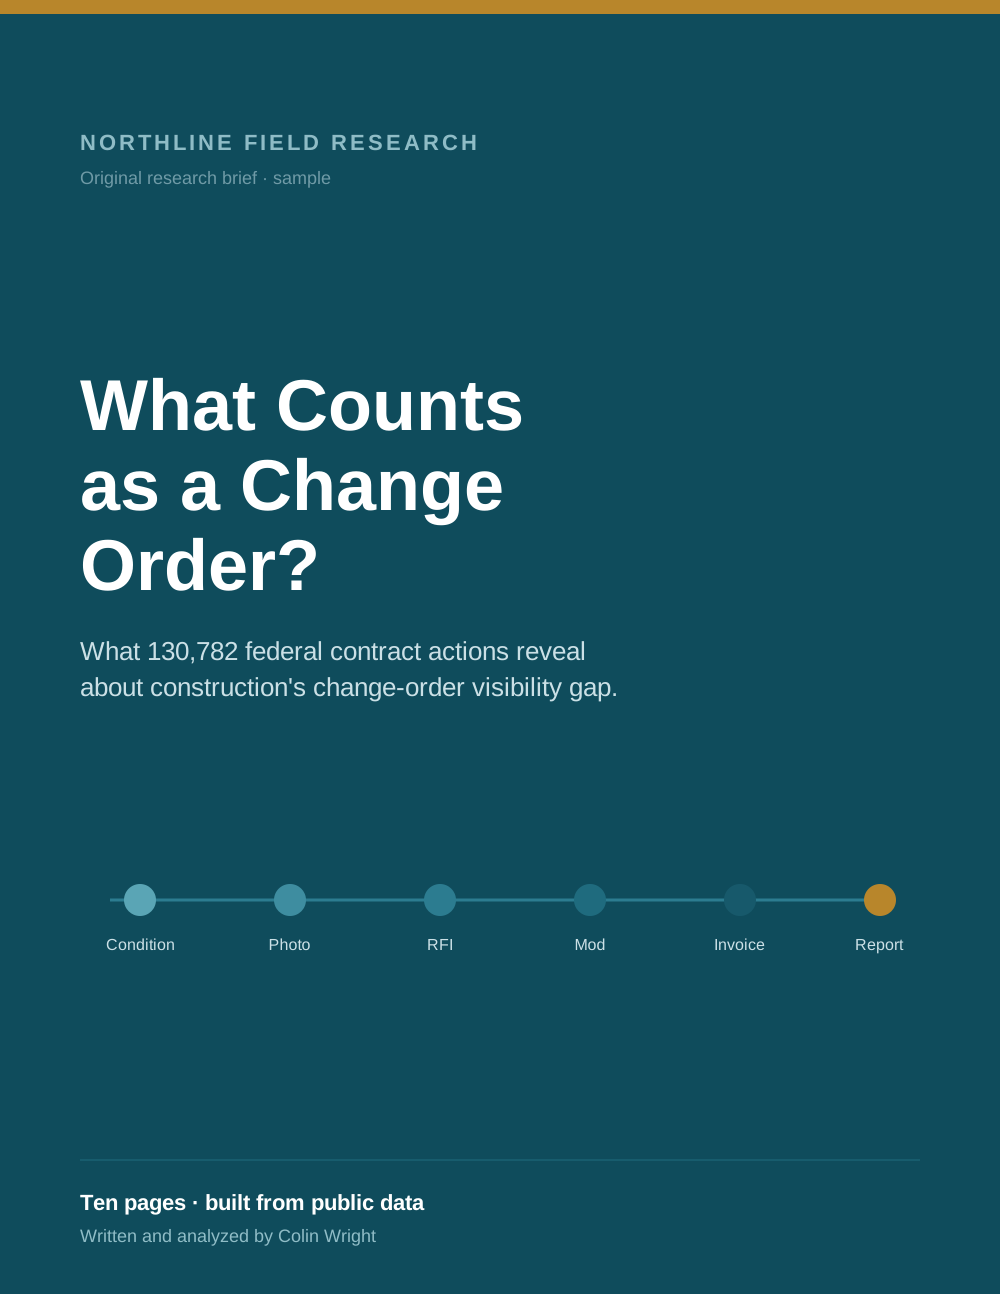
This is a ten-page research brief I built from public data. It uses federal construction contract records to ask a fairly simple question, which turned out to have a more complicated answer. I wrote the copy, ran the analysis, made the figures, and designed the document.
- 1,481
- completed $1M+ contracts in the headline cohort
- 30.6%
- carried an official change-order label
- 48.8%
- of audited descriptions (39 of 80) clearly changed the work
Every file is in the deliverables index at the bottom of the page. The rest of this page explains how the brief came together.
The brief I set myself
I wanted a piece that would hold up to a skeptical read, so I gave myself some deliberately strict rules. The idea was that nothing in the finished document should fall apart if a reader stopped to ask where a number came from.
- Public sources only. No proprietary or internal company data.
- No new interviews. The argument had to stand on records anyone can pull.
- Ten pages, tight enough to respect a busy reader.
- At least one original visual on every page.
- Polished enough to distribute as a finished publication.
Choosing the question
The most difficult decision when preparing for a research project is choosing which question to ask. I developed six candidate topics, each paired with a public dataset that could support it, and ran each through three filters.
Filter 1
Is there a surprise?
Does a counterintuitive finding plausibly exist in the data, or would the work only confirm what people already assume?
Filter 2
Can one person do it?
Can a single researcher run the analysis with public tools, without a team or a data budget behind them?
Filter 3
Would someone publish it?
Is there an identifiable organization that would put its name behind the finding, so the piece reads as a real property?
Change orders in construction cleared all three. The topic promised a surprise, public federal data could reach it, and it speaks to a real audience of contractors and the software companies that serve them.
Following one change from the field to the report
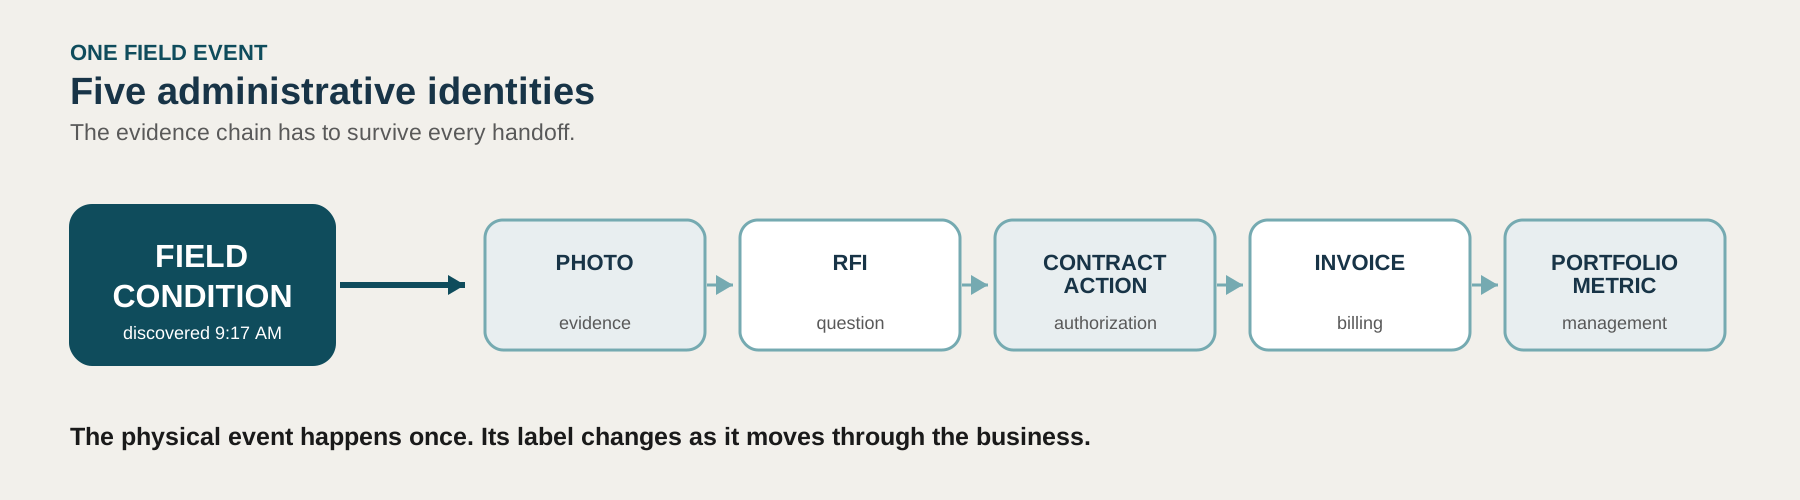
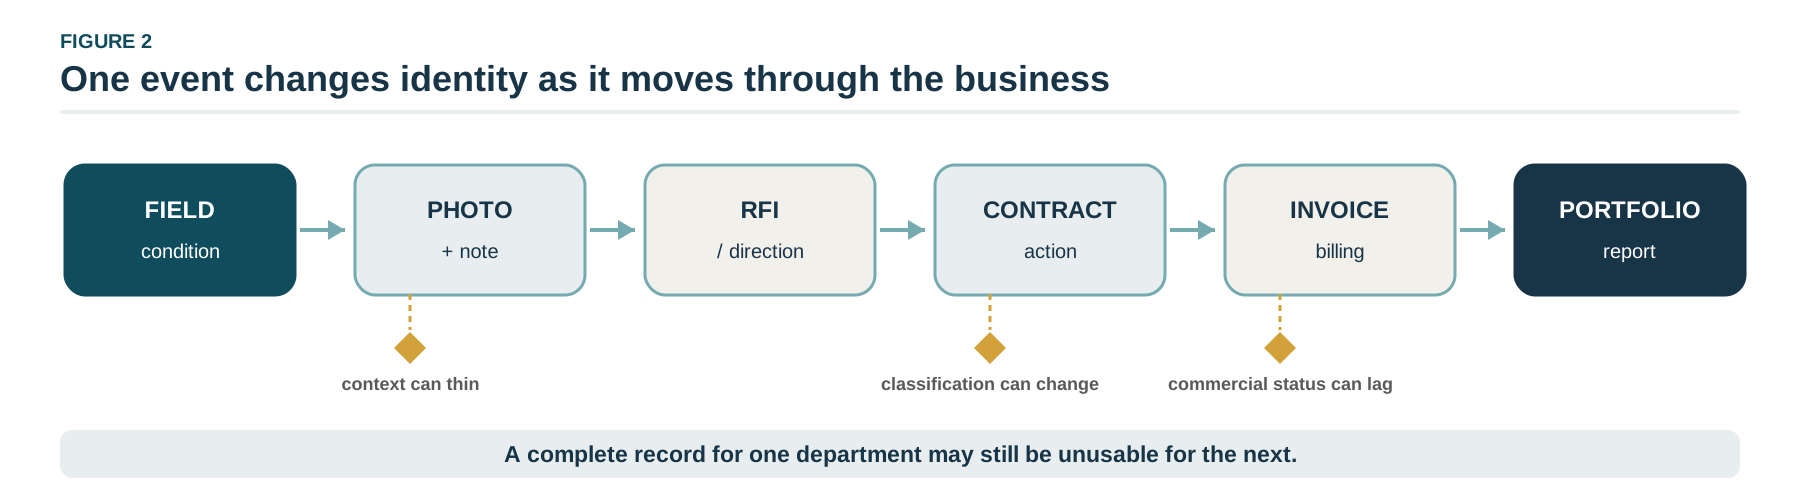
The brief opens with a scenario. At 9:17 on a Tuesday morning, a foreman opens a wall and finds conduit where the drawings show open space. He photographs it, calls the project manager, and moves the crew. By lunch the condition is a text thread. The project manager turns it into a formal question about the drawings. The contracting office later records a modification. Finance sees a cost adjustment. An executive sees one line in a quarterly report.
The physical condition only happened once, but its label changed at every handoff. That relabeling is what the paper is really about, and it’s a big part of why change-order numbers in this industry can be so misleading.
How the thesis changed
The thesis changed twice as I worked, and each version was smaller and more focused than the last. This is where most of the real editorial work happened: figuring out what the evidence could actually support, and then publishing that narrower claim instead of a bigger, more attention-grabbing one.
-
Public data can reveal what change orders cost.
Where I started. The federal contract files looked like a clean path to an industry benchmark.
-
The most-repeated industry statistic will not hold up.
First contraction. The familiar claim that change orders run 8 to 14 percent of contract value could not be traced to a primary source, and the best available research pointed much lower.
-
The category itself may not mean one consistent thing.
Second contraction. Reading the records showed the official labels mix substantive scope changes with schedule extensions, options, and administrative actions. The question moved from what change orders cost to whether the label measures anything stable.
Each step led to a more defensible position. The final claim is narrow, but anyone can check it against the same public records.
The research controls
I used four working tools to keep claims tied to the same underlying records and prevent the analysis from shifting while I wrote.
01
Source ledger
Every source catalogued with its type, owner, date, and planned use, so no citation entered the draft unexamined.
02
Claim ledger
Every factual assertion carried an ID, its source references, a verification status, and a required qualifier. A claim without a source ID stayed out of the draft.
03
Frozen analysis
Results were locked with a manifest of hashes, a random seed, and a version, so drafting referenced stable outputs instead of a moving calculation.
04
Manual audit
200 records hand-classified against a documented codebook, with random and high-dollar samples kept separate so one could not contaminate the other.
What the research found
Four findings carried the paper. Each one is stated here with the qualification it has in the brief, because none of these numbers means much on its own.
What the 3.24% actually counts
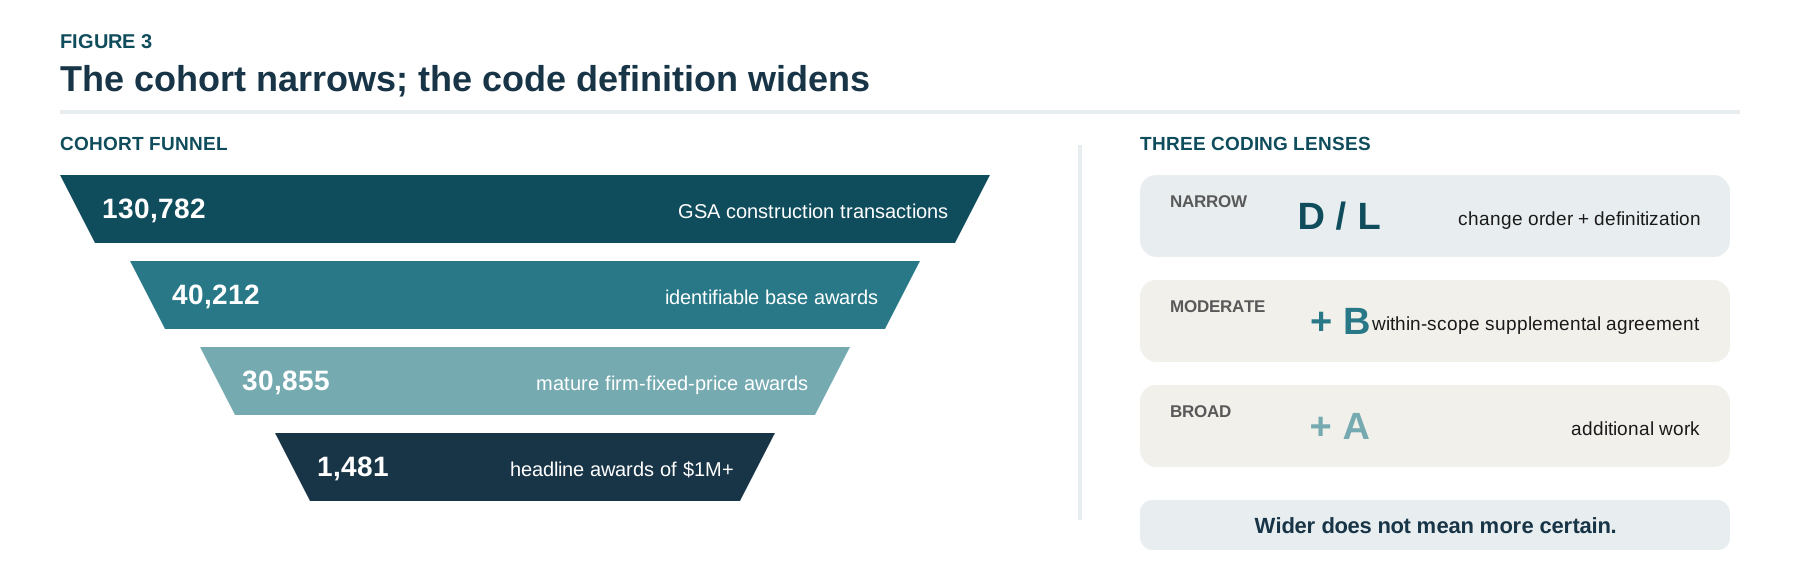
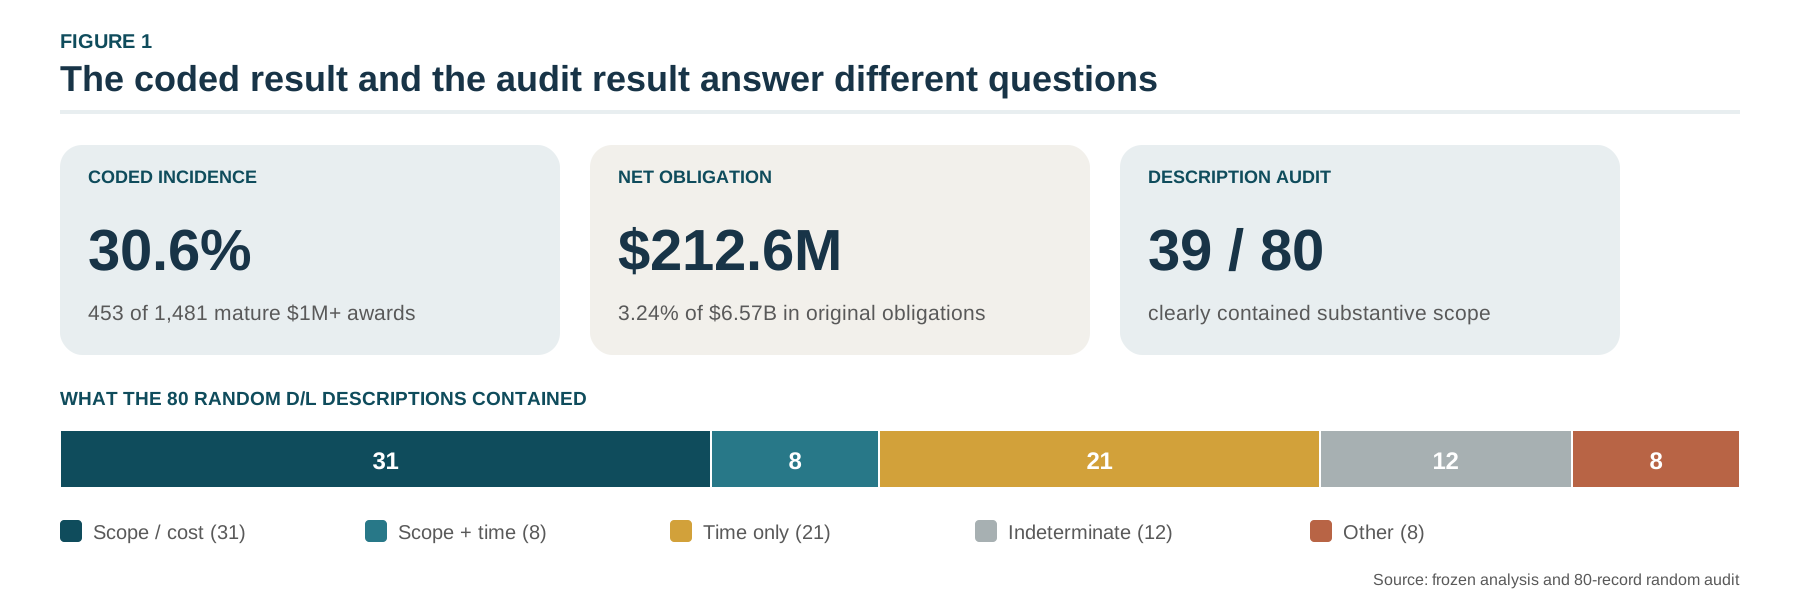
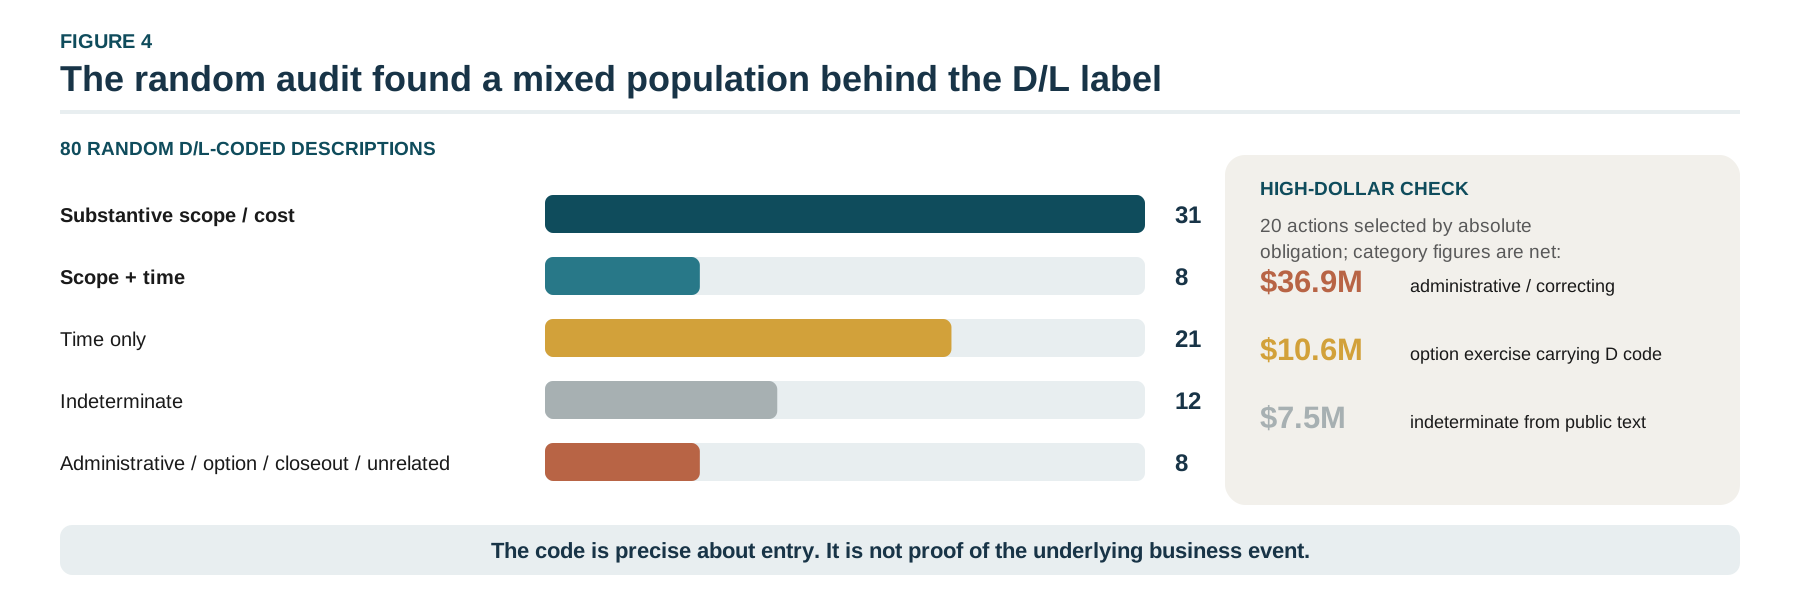
Across the 1,481 completed, firm-fixed-price GSA contracts that began with at least $1 million committed, actions carrying an official change-order code added $212.6 million net, or 3.24% of the amount originally committed. The math is reproducible, but the label is less dependable. In a random sample of 80 descriptions, 39 clearly changed the required work, 21 changed only the schedule, and the rest were paperwork, options, or too vague to classify. One $10.6 million action mostly exercised construction options while carrying a change-order code.
The qualification
The 3.24% is a reliable total for records carrying the “change order” label. That label covers scope changes, schedule extensions, options, and paperwork together, so the figure does not indicate what change orders cost.
What the descriptions actually said
Reading the records by hand showed what the codes conceal. In the random D/L sample, 31 records clearly changed physical or professional work and eight more changed both work and schedule, for 39 total. Twenty-one changed the schedule only. The high-dollar review was even more lopsided. A single $10.6 million option exercise sat under a change-order code, alongside millions in administrative and correcting records.
The qualification
The 80-record random sample carries an approximate 95% margin of error of plus or minus 11 percentage points. The high-dollar records are diagnostic, and are reported on their own rather than blended into the rate.
Incidence rises sharply with contract size
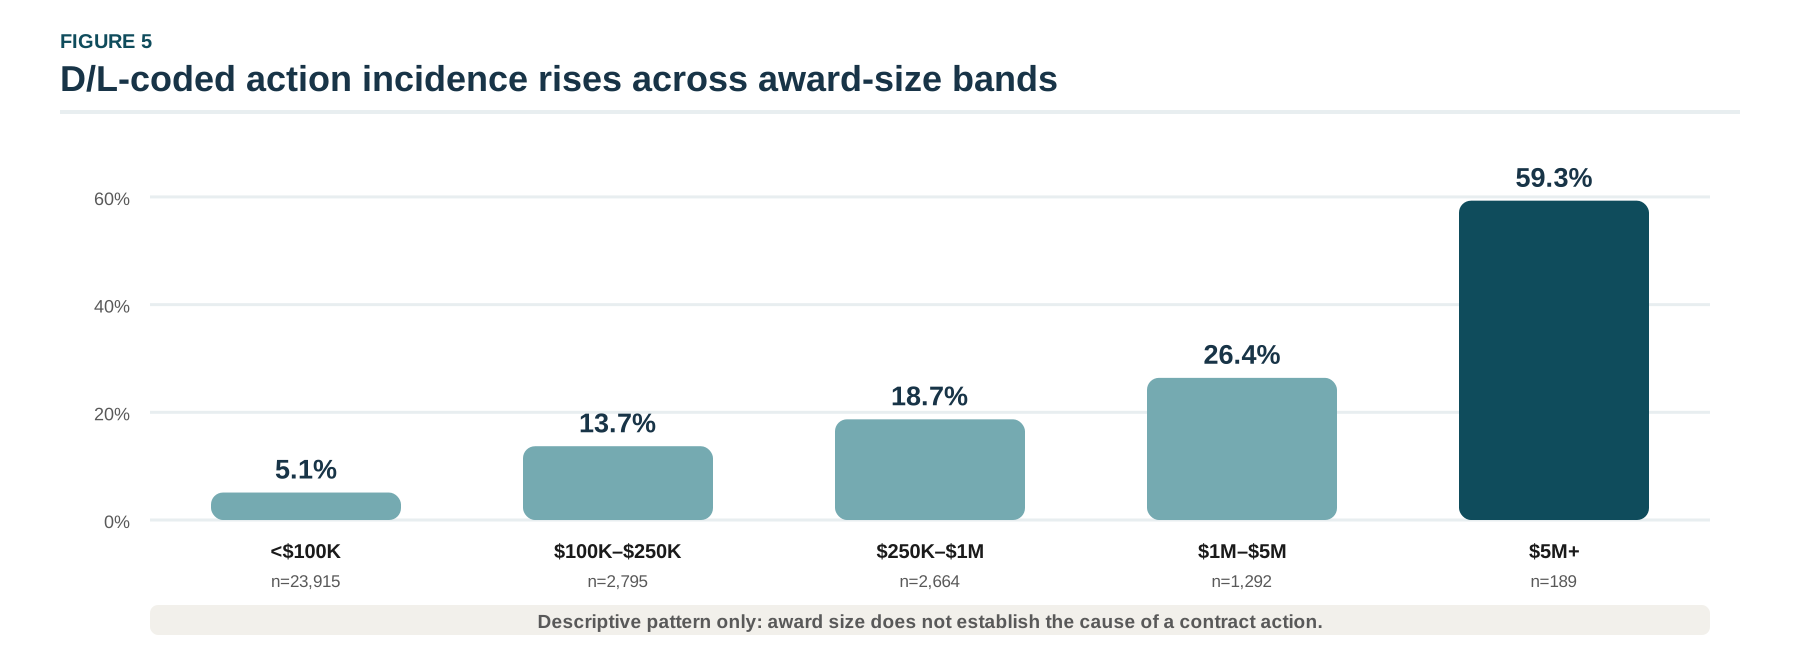
Official change-order labels appeared far more often as contracts grew, from 5.1% on contracts below $100,000 up through the size bands to 59.3% on contracts of $5 million or more. The gradient is real, and it’s the point at which record quality stops being a clerical concern and starts to affect what a company-wide report can accurately show.
The qualification
This does not prove that larger contracts cause more changes. Bigger awards involve more time, more people, and more chances for a contract action. The data does not separate those factors or identify who initiated a change.
The answer depends on which codes you count
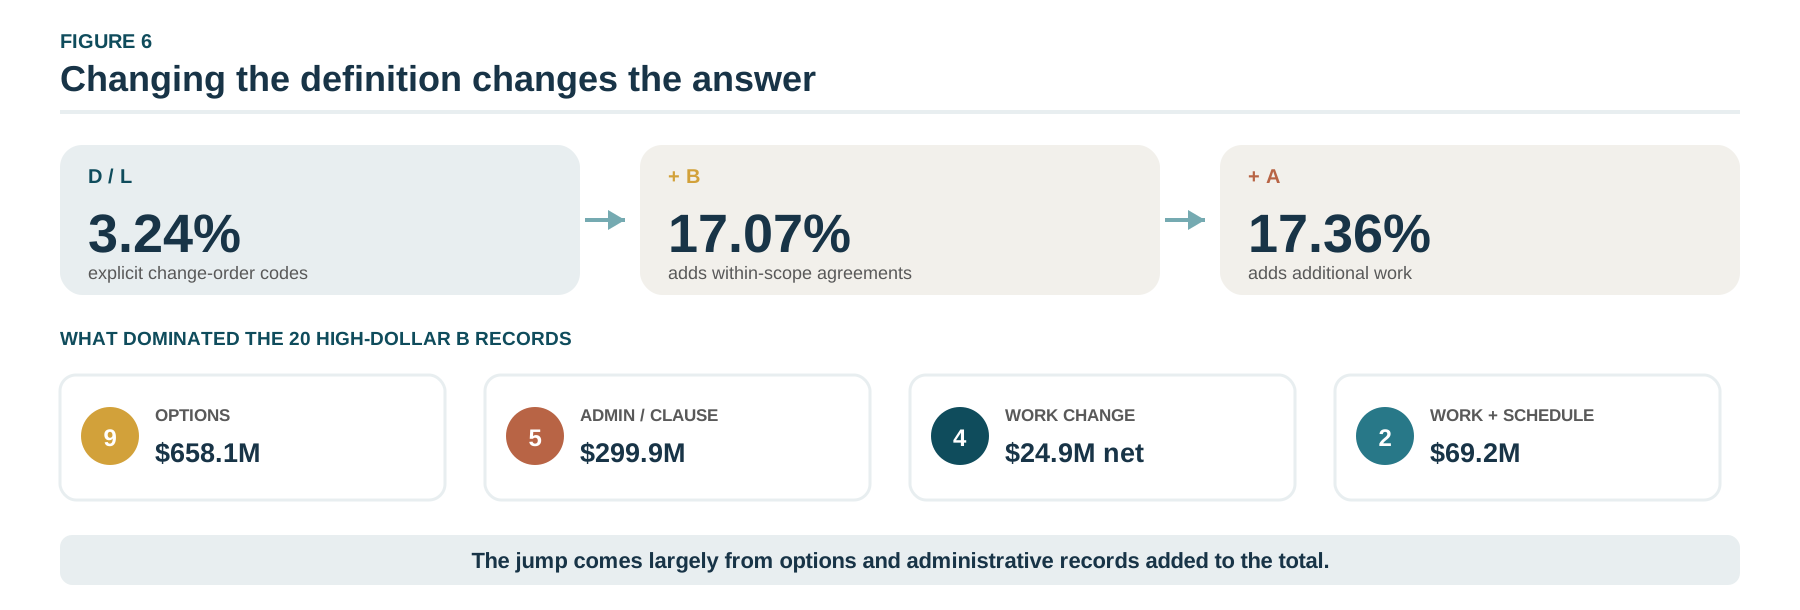
The same contracts produce very different numbers depending on which codes count. The narrow definition yields 3.24%. Adding within-scope supplemental agreements raises the apparent figure to 17.07%. Adding additional-work agreements moves it only slightly, to 17.36%. Reading the largest of those added records showed why the jump is a warning rather than a range. Nine of them established or exercised options worth $658.1 million, which are not changes at all.
The qualification
Widening the definition to include options and paperwork produces that jump. No additional change orders turned up, which is why 17.07% cannot serve as an upper estimate of cost.
A practical response
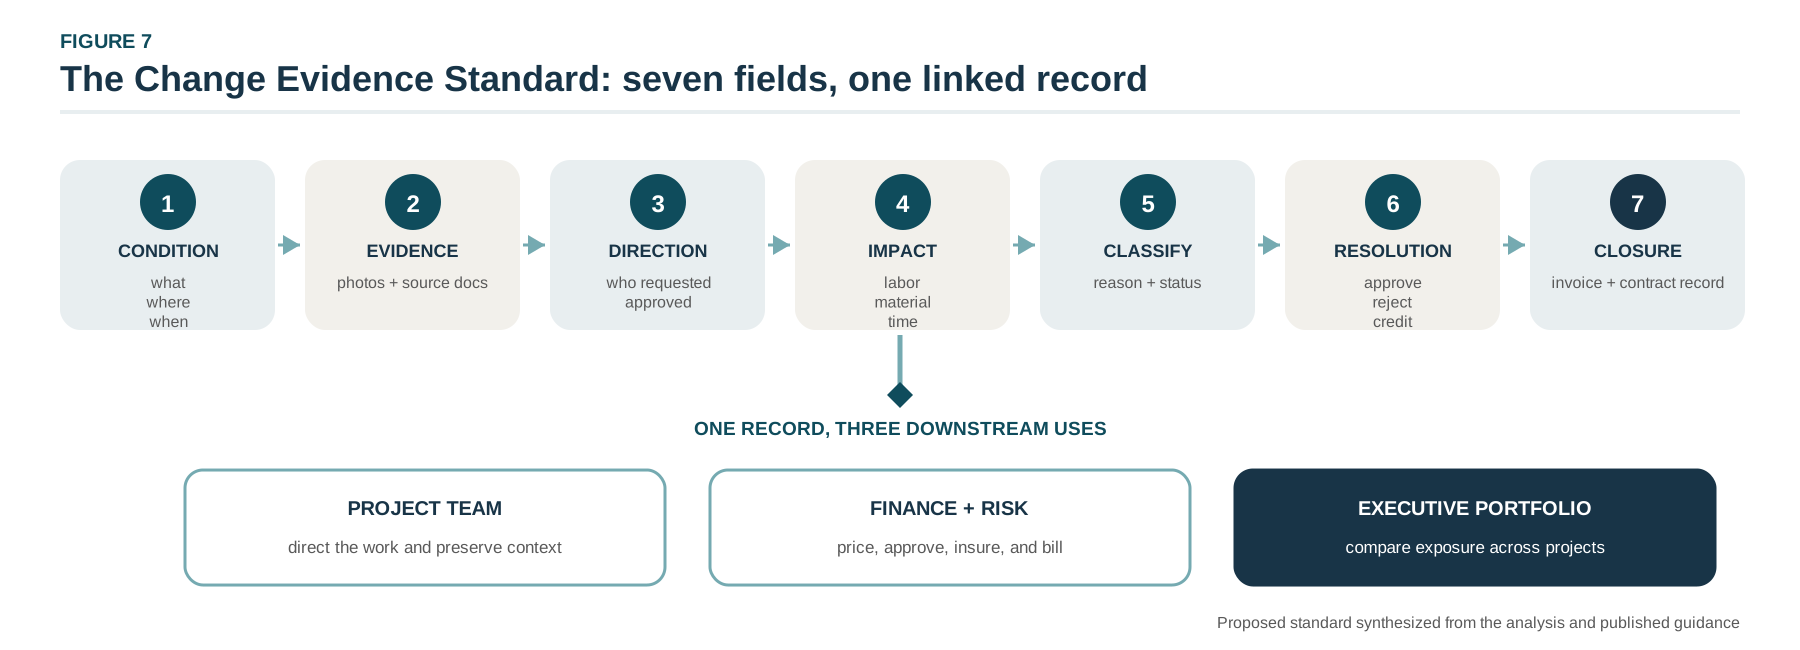
It didn’t seem right to identify a classification problem without suggesting a way to address it, so the brief closes with one. The Change Evidence Standard is a set of seven fields that stay linked from the first field evidence through closeout: Condition, Evidence, Direction, Impact, Classification, Resolution, and Closure. It keeps schedule-only actions, options, paperwork, and true scope changes apart at the point of capture, which is the cheapest place to keep them separate.
Fact-checking every claim
After the fourth editorial draft, I went back through the paper the way a hostile reviewer would, and pulled out every statement that needed evidence, starting with the number in the title and ending with the contact details on the back cover. That produced 104 separate claims. The earlier claim ledger governed what went into the draft; this one tests what came out.
Each claim is a row carrying its risk level, the kind of check it needs, where it sits in the paper, every other place the same figure repeats, the source that should support it, and the steps to reproduce or confirm it. 78 are rated high risk, which covers the headline numbers, the quotations, the named organizations, and anything a reader is likely to repeat somewhere else. 30 are calculations that have to be rerun against the frozen analysis files rather than read off an earlier draft. Ten rest on outside publications, catalogued on a second tab with a publisher, a URL, and the specific passage the checker has to open.
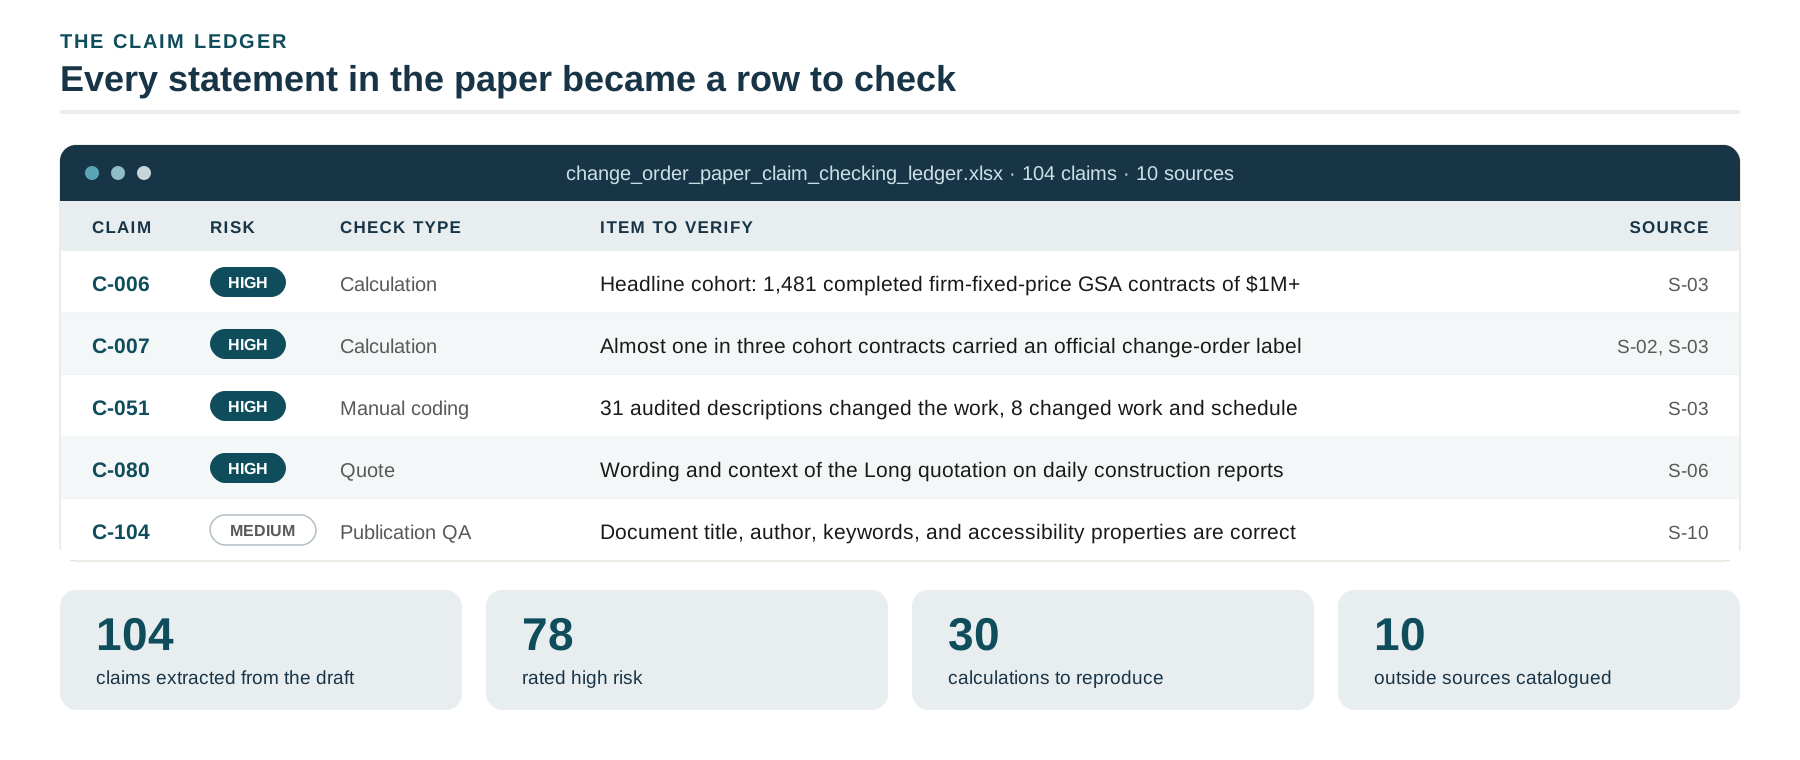
Completing a row and actually believing a claim are tracked in separate columns, which is a small distinction that matters quite a bit. A row closes only after the evidence has been opened and a result has been recorded as verified, verified with qualification, revised and needing a recheck, unsupported, or unresolved. The presence of a citation never counts as a check, and no AI review is allowed to stand in for the original record.
Two pieces of this are portable. The phase-by-phase checklist works on any high-stakes document, and a pair of AI system prompts handles the mechanical part of extracting and testing claims while leaving the judgment with a person. Both are in the deliverables index, along with the ledger itself, which is published as a blank working copy so it can be reused. The full process calls for an independent second checker on high-risk claims and a named approver for anything qualified or removed, so after checking every claim myself, I had the paper independently fact-checked by other reviewers before calling it final.
Errors, and how they were caught
Most research writeups don’t list their own mistakes, but I’m including three here because they show where the review process made a difference. Several AI systems reviewed the work at different stages, and when they disagreed, the frozen analysis files settled it.
-
A wrong byline
An early draft carried an incorrect author attribution. A review pass caught it before the version was shared.
-
A double-counted audit statistic
The narrative summary presented eight scope-and-time records as additional to a total that already contained them. Corrected to 31 scope-or-cost records plus eight scope-and-time records, 39 in total.
-
Two miscounted review claims
A review itself introduced two miscounted style claims. Those were checked against the frozen outputs and corrected in turn.
The artifact
The research and work are real, but the paper is published under a fictional imprint, Northline Field Research, so it could be presented as a finished publication. Northline isn’t a real client, and every publisher and call-to-action element in the document is labeled as sample material.
What the analysis cannot show
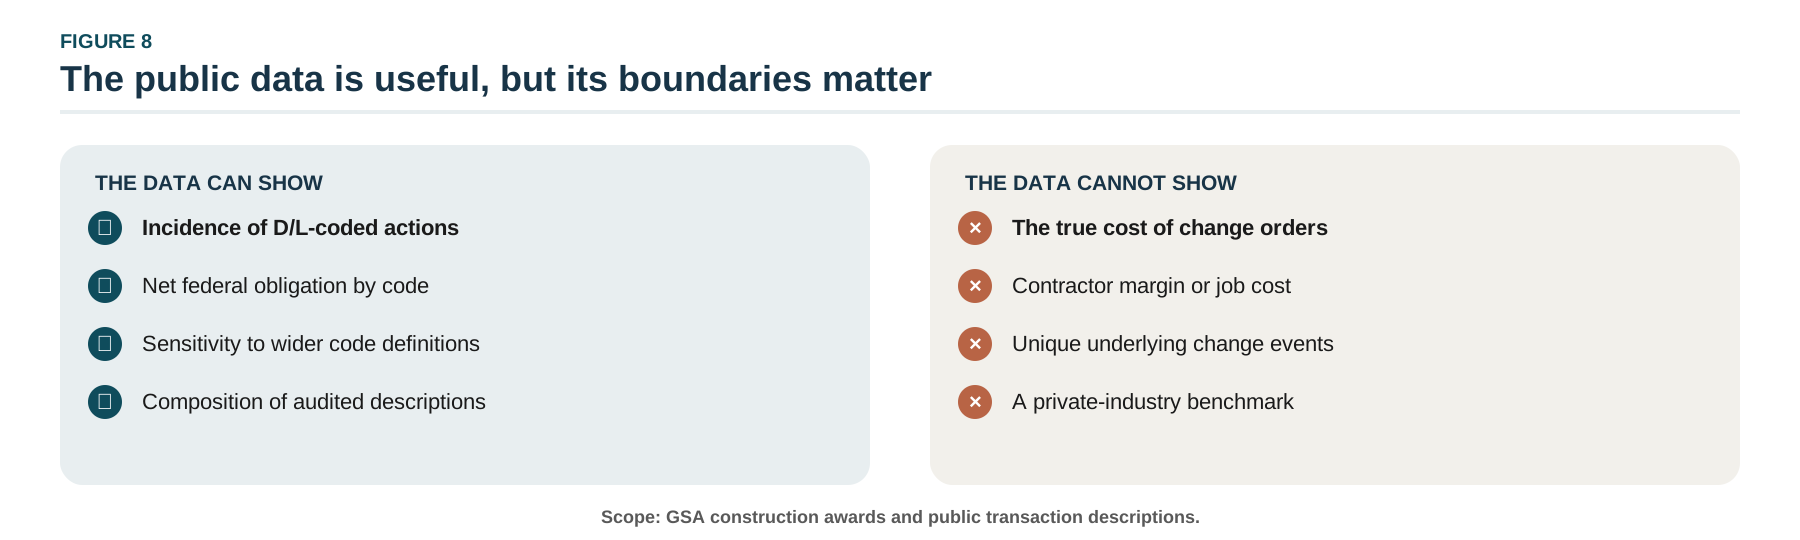
The panel covers GSA awards only, so it is a transparent federal case study rather than a sample of the whole construction industry. Federal obligations are amounts committed, which do not reveal contractor margin, job cost, or final project cost. Transaction descriptions summarize rather than document, so an indeterminate record simply means the public text was insufficient. And a coded action is not proof of a unique event, since an initial direction and a later pricing action can describe two stages of one change.
Planning the follow-on content
Before writing a derivative, I mapped a larger program around the paper: 30 assets across six tiers, pulled from an inventory of the findings, frameworks, and narrative the brief already contains.
Five built, the rest mapped
Of the thirty planned assets, five are finished, and each one is downloadable below.
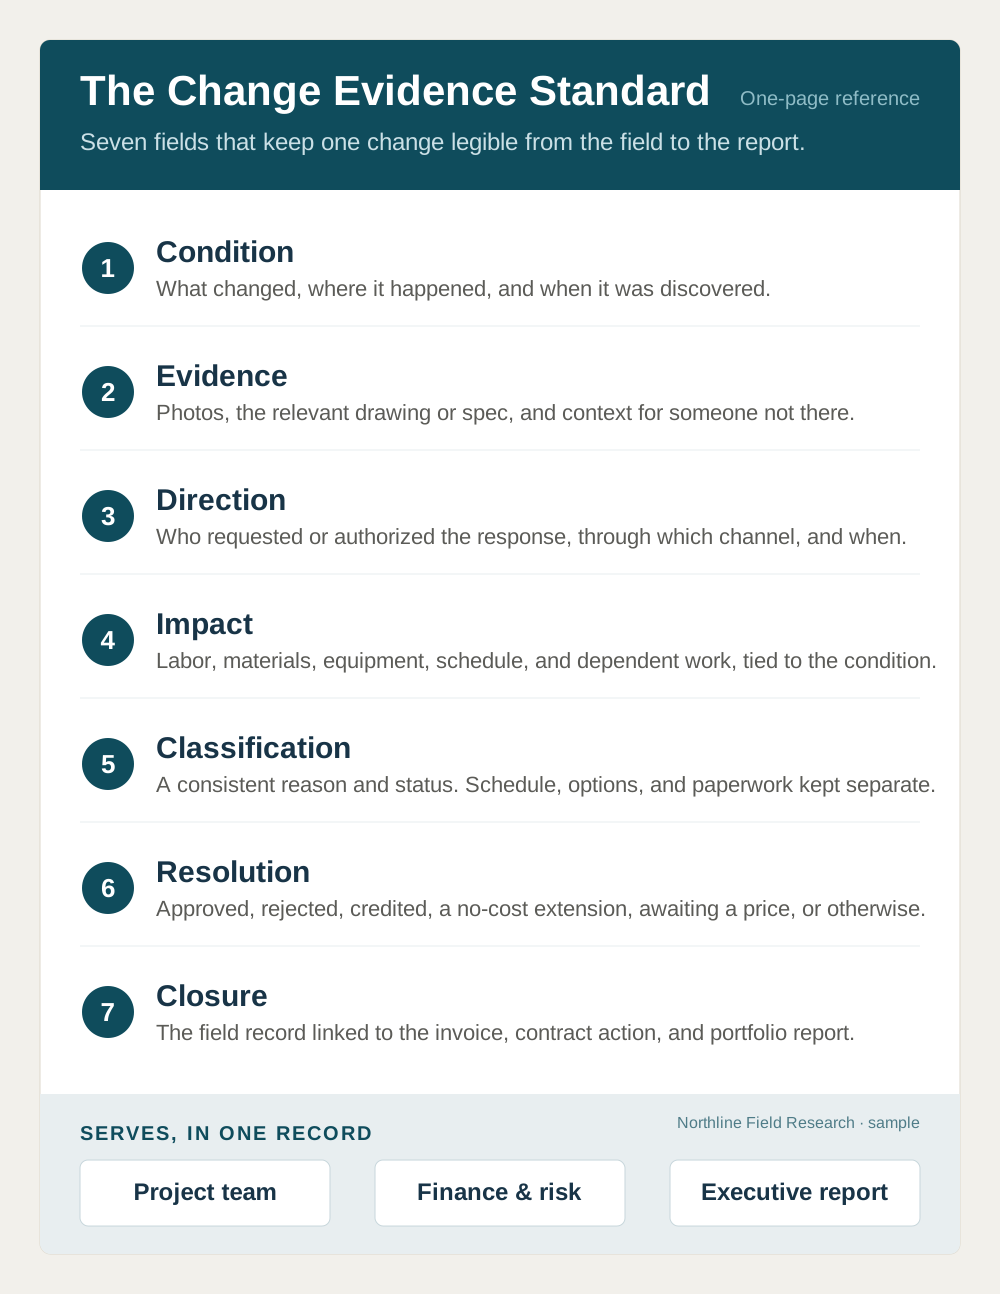
Change Evidence Standard
The seven-field one-pager the brief promises on its back cover.
Download (SVG)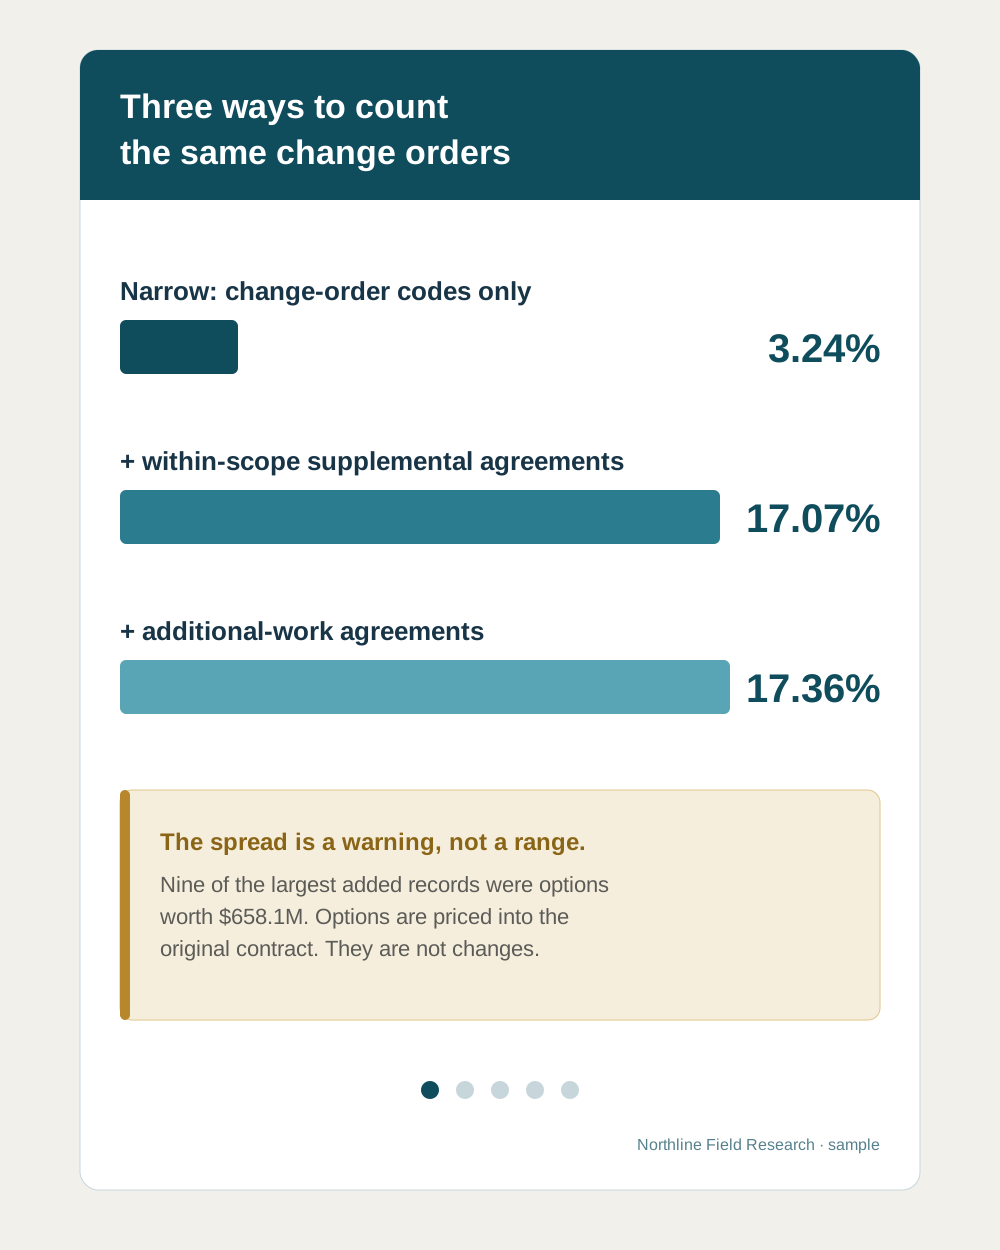
Definition-gap carousel
The ladder finding recut from landscape to a portrait social slide.
Download (SVG)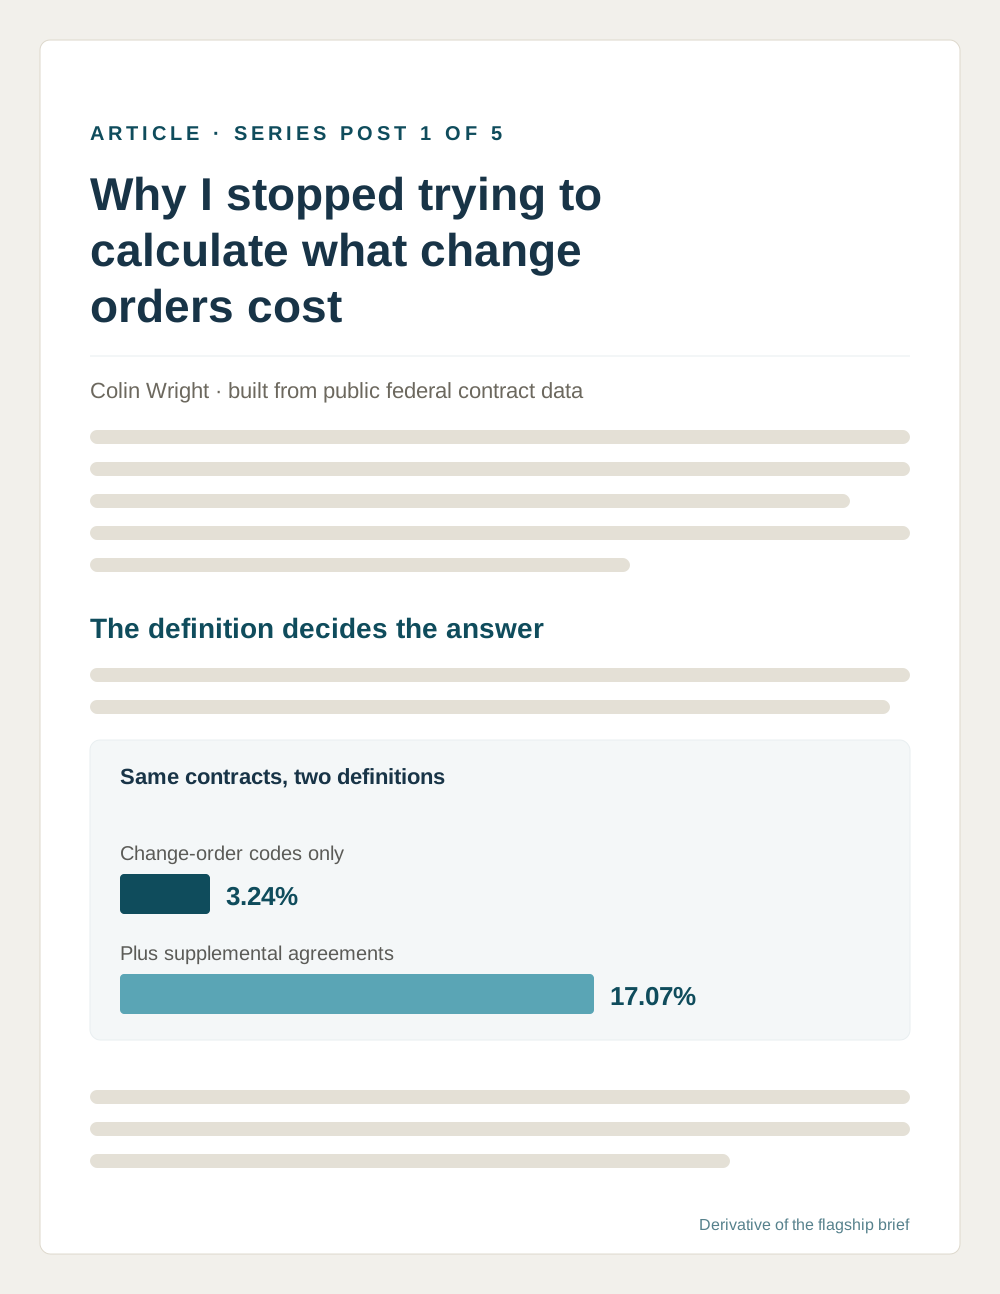
Lead article
“Why I stopped trying to calculate what change orders cost,” the series opener.
Read (Markdown)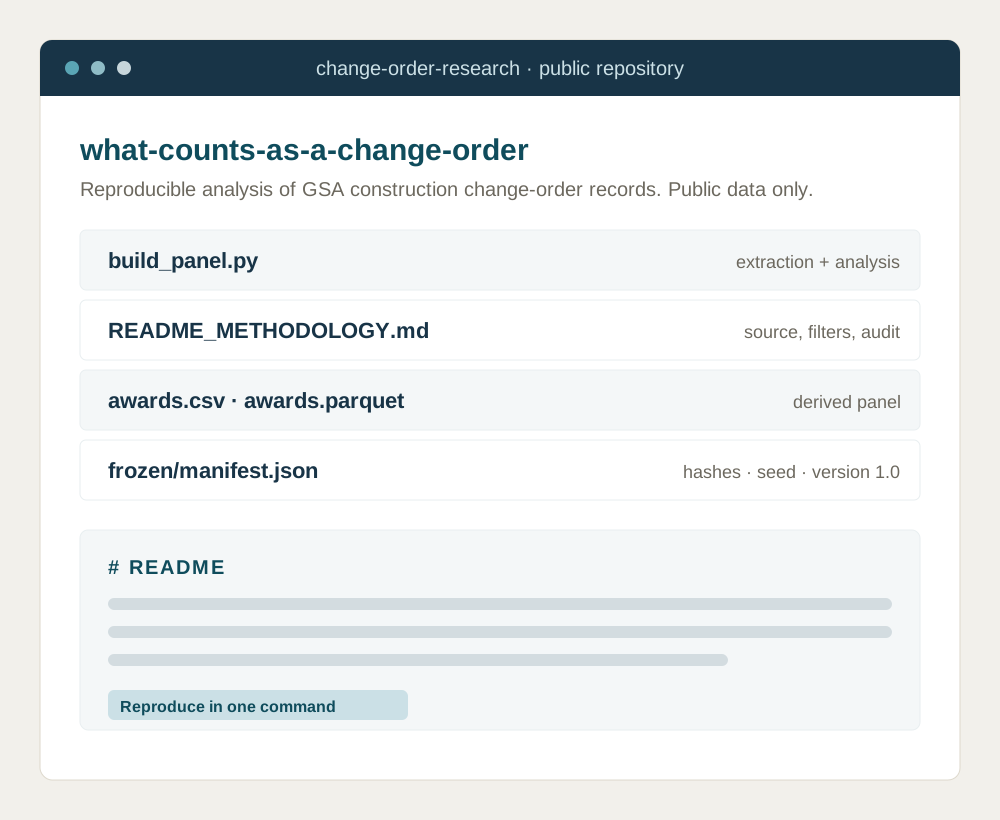
Reproducibility package
Script, methodology, derived panel, and manifest, packaged to reproduce.
Download (ZIP)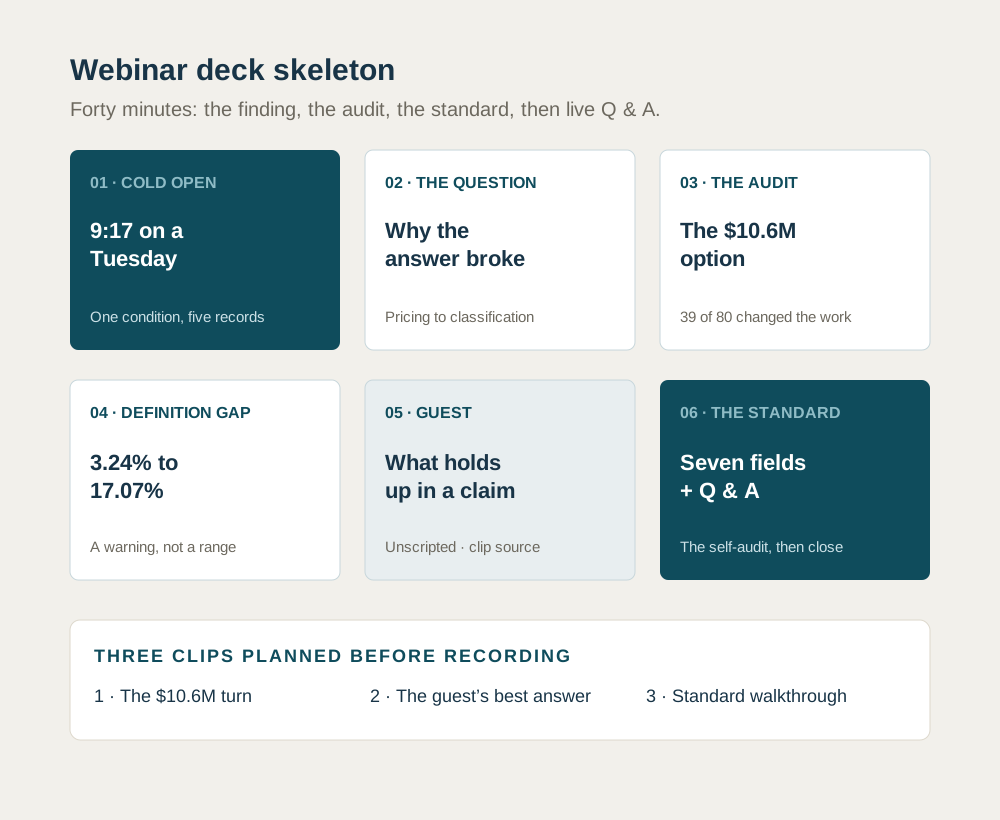
Webinar deck skeleton
A forty-minute run of show and the opening slides, ready to record.
Download (SVG)The rest of the plan
The other twenty-five sit in the plan, organized by tier. All nine of the paper’s figures already exist and can be recut for each channel without redrawing.
| Tier | What it holds | Assets |
|---|---|---|
| Companion downloads | The one-page standard, a self-audit worksheet, an executive summary, a classification codebook, and a reproducibility package. | 5 |
| Article series | Five standalone posts, each pointing back to the paper, led by the thesis-shift story rather than the number. | 5 |
| Social | Carousels, single-anecdote posts, a size-gradient chart, a process thread, and a short screen-recorded video. | 8 |
| Live and spoken | A webinar with a guest, a conference talk, a podcast guest kit, and the cut-downs from the recording. | 4 |
| Sales enablement | Role-specific one-pagers, a discovery question set, an objection handler, and a benchmark conversation starter. | 4 |
| Earned and syndicated | A trade-press pitch, a bylined article, an association feature, and the dataset as a citable resource. | 4 |
The full breakdown, atom inventory, specimens, and launch sequence are in the derivative content plan, linked below.
The refresh path
The same analysis could be updated annually by adding another agency or rerunning it with a trailing year of data. The files and controls are already set up for that refresh.
What proprietary data would change
This brief used public records only, with no internal data and no interviews, and it was still enough to support a documented 30-asset program. A company’s platform data and subject-matter experts would make the findings specific to that company instead of reproducible from the same public files.
Deliverables index
Everything the project produced, in one place.
-
The research brief
PDF
The ten-page paper, What Counts as a Change Order?
-
Dataset and analysis code
ZIP
The extraction and analysis script, methodology, and the derived award panel. The reproducibility package.
-
Atomized content, all five
ZIP
Every built derivative in one archive, plus the lead article in full. The individual files are listed below.
-
Change Evidence Standard
SVG
The one-page seven-field reference.
-
Definition-gap carousel
SVG
The ladder finding as a portrait social slide.
-
Lead article
Markdown
“Why I stopped trying to calculate what change orders cost.”
-
Webinar deck skeleton
SVG
The forty-minute run of show and opening slides.
-
Claim-checking ledger
XLSX
All 104 claims with risk level, check type, source IDs, and reproduction steps, plus the source library and the recommended order of work. Published as a blank working copy.
-
Fact-checking checklist
DOCX
The reusable phase-by-phase process, written for any high-stakes document rather than this one.
-
AI fact-checking prompts
DOCX
Two copy-ready system prompts: one builds the claim ledger, the other verifies against the evidence package.
-
Process record
Markdown
A first-person account of how the brief was researched, checked, and corrected.
-
Derivative content plan
Markdown
The full 30-asset plan, atom inventory, specimens, and launch sequence.